Technical Validation
[Demonstrate the quality and reliability of the data through quantitative quality metrics, reproducibility analyses, and comparisons against established benchmarks.]
fMRI data quality
Functional image quality was assessed with MRIQC Esteban et al., 2017, computed per
run on the raw BOLD data. We report head-motion and temporal signal-to-noise ratio (tSNR)
image-quality metrics (IQMs) across the 4,537 functional runs with released MRIQC
derivatives, spanning 17 datasets, all six participants, and 880 unique
dataset × subject × session combinations. Four datasets (anat, emotion-videos,
langlocalizer, mario) have no BOLD MRIQC derivatives available yet and are excluded
from this analysis; the numbers below therefore describe the datasets with released
MRIQC derivatives, not the full collection. No pass/fail threshold is applied anywhere in
this analysis and no run is excluded — the distributions below describe the released data
as-is.
Head motion, summarized as mean framewise displacement (FD) per run
Power et al., 2012, was low overall: median 0.145 mm (mean 0.147, SD 0.062, range
0.046–0.480 mm across runs). No run exceeded a mean FD of 0.5 mm, and 787 runs (17.3%)
exceeded 0.2 mm. At the volume level (3,582 runs with MRIQC framewise-displacement
timeseries available), a median of 21.7% of volumes per run exceeded 0.2 mm and a median
of 0.5% exceeded 0.5 mm (means 23.2% and 2.1%). Motion varied about 2.5-fold across
participants — sub-03 and sub-04 showed the lowest motion (median FD 0.074 and 0.081 mm),
sub-02 and sub-06 the highest (0.178 and 0.187 mm) — while sub-01 and sub-05 fell in
between (0.122 and 0.132 mm). Motion also varied systematically with task demands: passive
paradigms such as floc, movie10, and hcptrt had the lowest median FD (0.111–0.118 mm),
while the video-game datasets mario3, shinobi, and mariostars had the highest
(0.177–0.206 mm), consistent with the additional head movement associated with active
gameplay.
Temporal SNR followed the inverse pattern: median 29.8 across runs (mean 29.6, SD 5.3,
range 11.5–40.1), with a strong negative correlation between per-run mean FD and tSNR
(Pearson r = −0.76, Spearman ρ = −0.77) — runs and participants with more motion have
correspondingly lower tSNR. Per-subject median tSNR ranged from 26.5 (sub-06) to 35.2
(sub-03), and per-dataset median tSNR from 22.3 (shinobi) to 33.0 (hcptrt).
Regional tSNR was further characterized by averaging per-run tSNR maps within a combined
Schaefer-1000/7-network cortical Schaefer et al., 2018Yeo et al., 2011, Tian-S3 subcortical
Tian et al., 2020, and Nettekoven cerebellar Nettekoven et al., 2024 atlas, collapsed to
11 region groups. This analysis covers 936 runs from the floc, retinotopy, and things
datasets only, as the per-run tSNR maps for the remaining datasets sit on credentialed
data remotes that were not retrievable for this pass; the regional pattern below should be
read as illustrative of the acquisition’s spatial signal-quality profile rather than as a
comprehensive summary. Median tSNR was lowest in the Limbic network (18.7 — orbitofrontal
and ventral-temporal cortex) and in subcortical structures (thalamus 27.4, caudate 28.6,
putamen 29.0) and cerebellum (30.7), and highest in dorsal cortical networks (Dorsal
Attention 46.5, Control 43.6, Somatomotor 43.4, Salience/Ventral Attention 42.6, Default
40.7, Visual 37.7). This ordering reflects the expected susceptibility-dropout pattern of
gradient-echo EPI near air-tissue interfaces, a property of the acquisition geometry
rather than of CNeuroMod specifically; users of ventral-temporal, orbitofrontal, or deep
subcortical signal should budget for reduced tSNR in these regions.
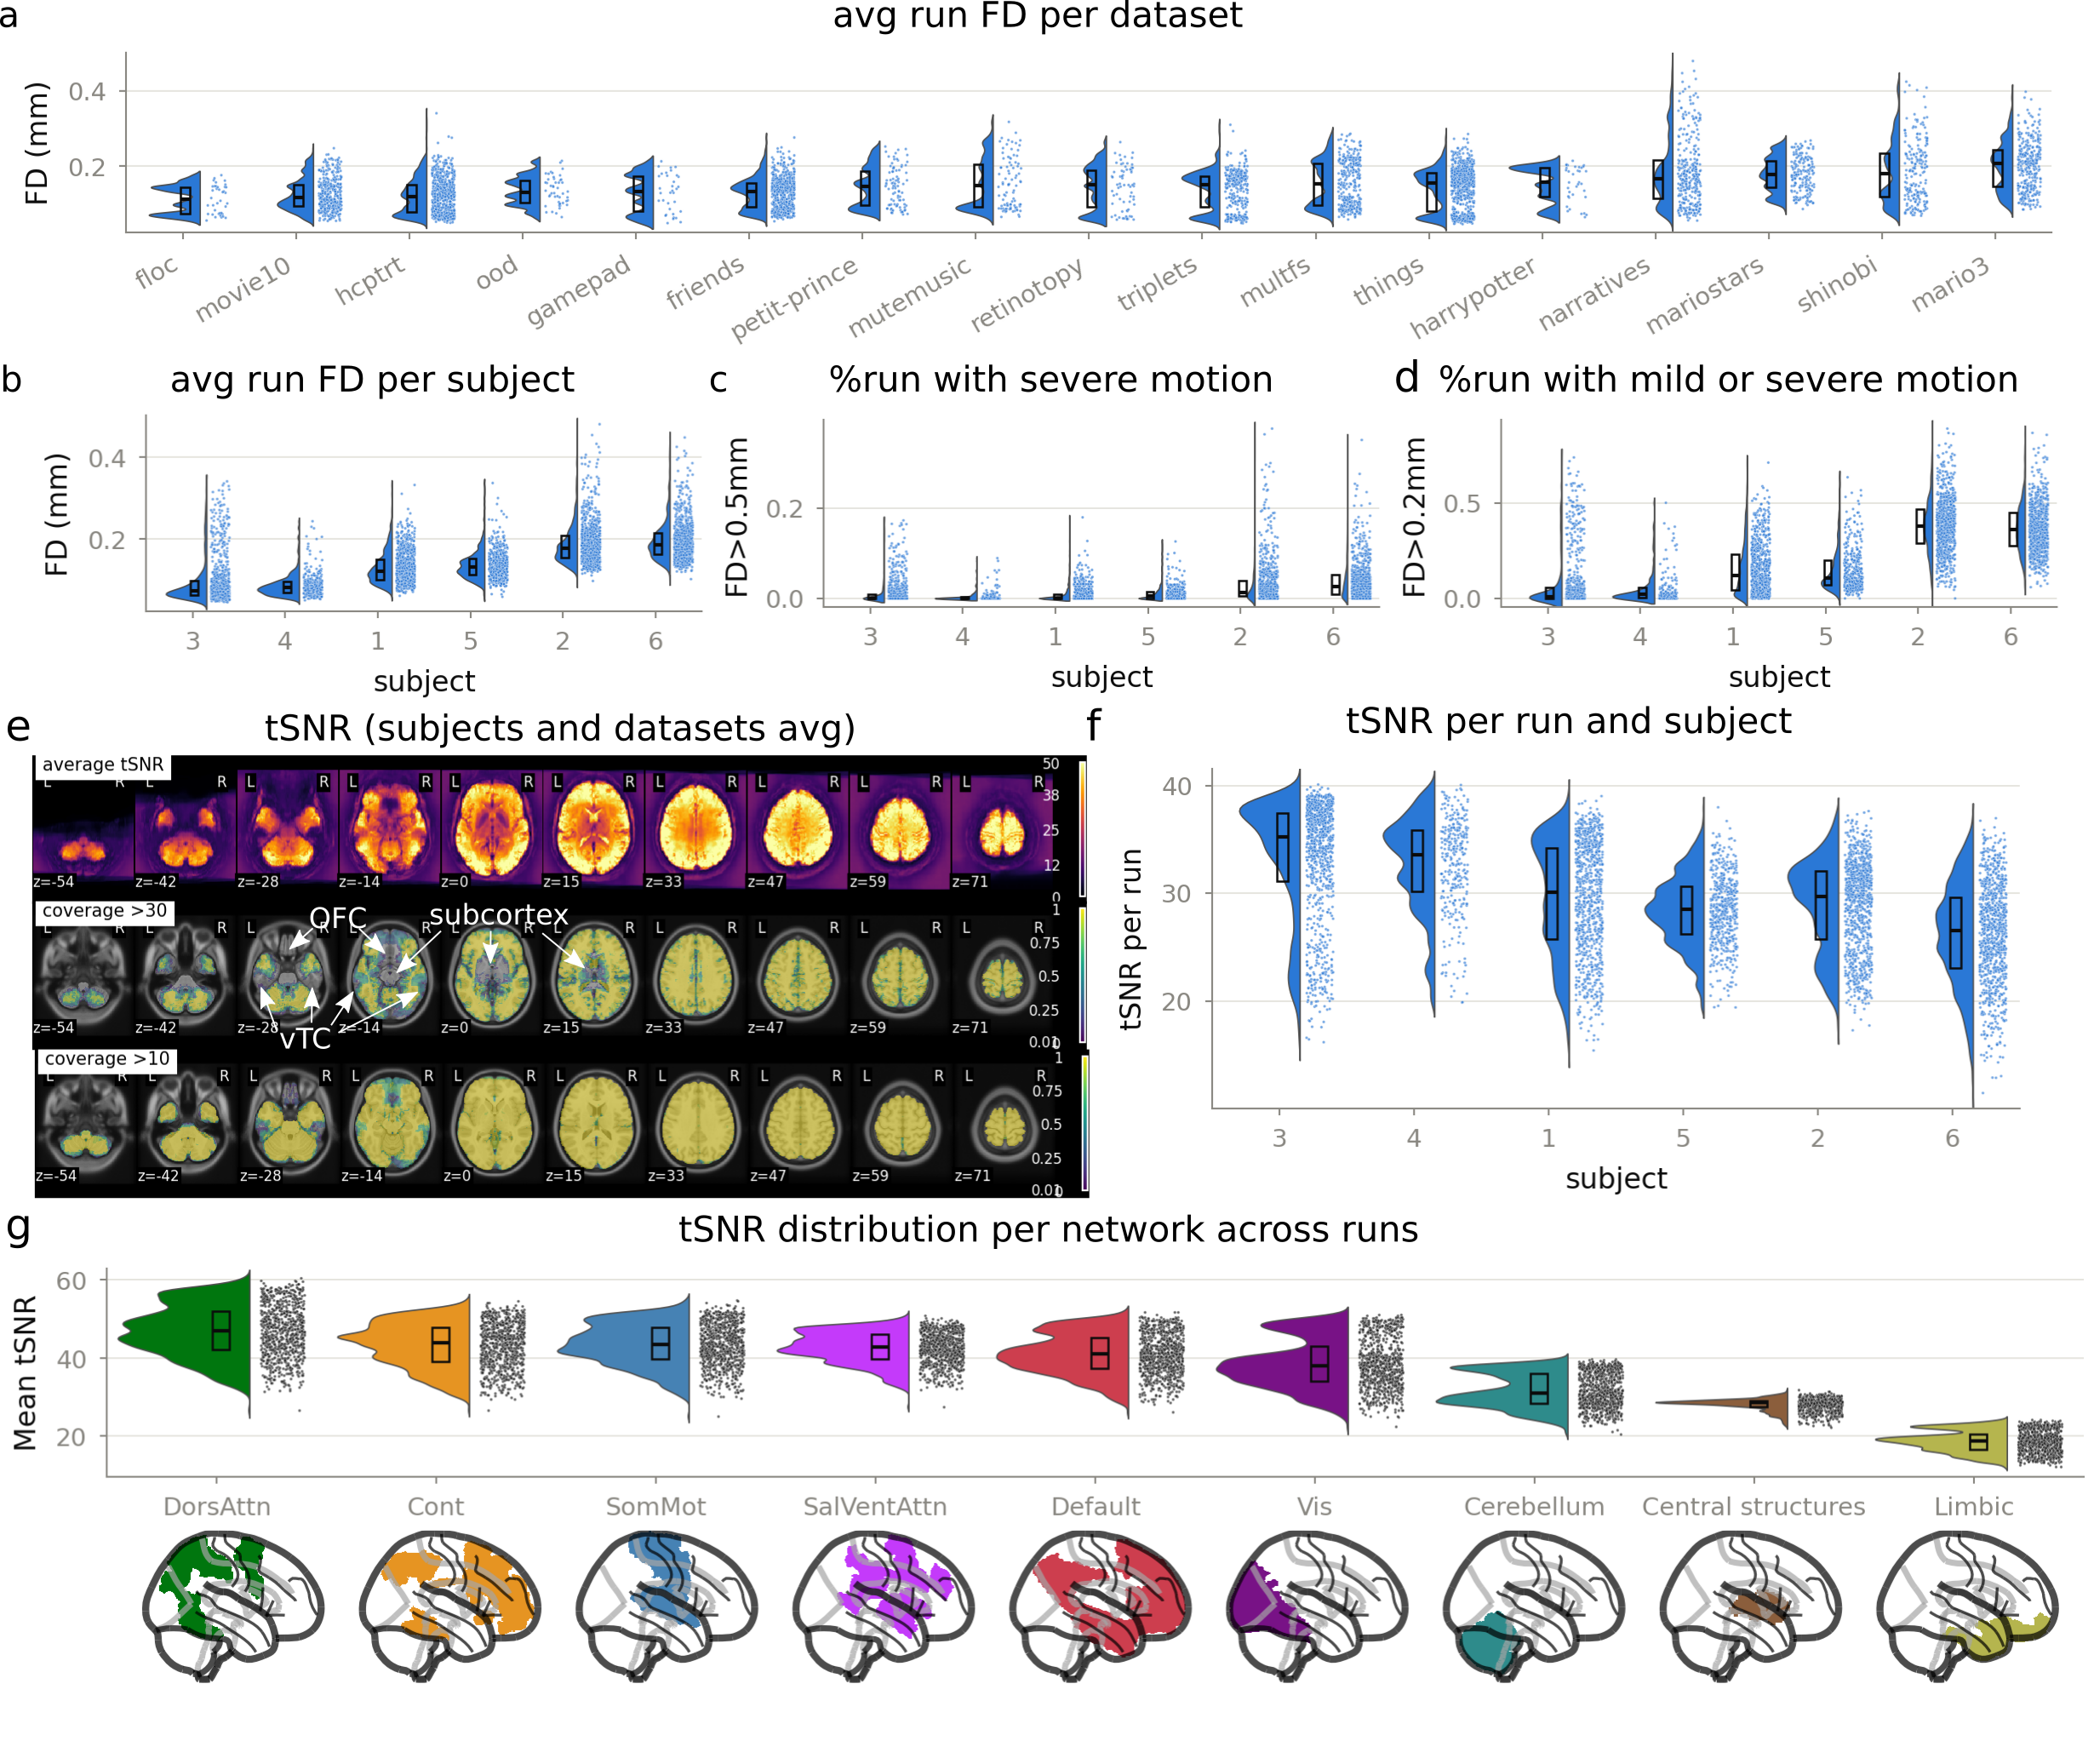
Figure 1:fMRI data quality across the CNeuroMod datasets. (a) Average run FD per dataset.
(b) Average run FD per subject. (c) Percentage of runs with severe motion (mean
FD > 0.5 mm) per subject. (d) Percentage of runs with mild or severe motion (mean
FD > 0.2 mm) per subject. (e) Average tSNR maps across subjects and datasets (top),
with voxelwise coverage maps thresholded at tSNR > 30 (middle) and tSNR > 10 (bottom);
orbitofrontal cortex (OFC), ventral temporal cortex (vTC), and subcortex are annotated as
regions of reduced coverage. (f) tSNR per run, by subject. (g) tSNR distribution
per region group across runs (floc, retinotopy, things), from worst (Limbic) to best
(Dorsal Attention), with matching glass-brain maps of each region group below.
Taken together, these metrics indicate low and stable head motion and adequate temporal signal quality across the released functional runs, with expected, interpretable variation across participants, tasks, and brain regions. The main limitations of this first-pass analysis are its restriction to datasets with released MRIQC and tSNR derivatives, and the regional breakdown’s reliance on a three-dataset subset; both will be extended as further derivatives become publicly available.
sMRI data quality
Structural image quality was assessed separately across the anatomical acquisitions of the same six participants and is reported in a companion publication [MISSING REF: companion CNeuroMod structural data quality paper — citation to be supplied].
Longitudinal stability and state-dependence of fMRI measures
Session-level within-network functional connectomes were computed from the parcellated
BOLD timeseries of cneuromod.all, using the cneuromod2026 parcellation — 1,134 parcels
combining a Schaefer cortical parcellation Schaefer et al., 2018, grouped into the 7 Yeo
cortical networks Yeo et al., 2011, a Tian subcortical parcellation Tian et al., 2020,
and a Nettekoven cerebellar parcellation Nettekoven et al., 2024. Runs were z-scored
individually and concatenated within a session, and connectomes were estimated
independently within each network (Pearson correlation of parcel timeseries, Fisher-z
transformed). Session-pair similarity is the Pearson correlation between two sessions’
Fisher-z edge vectors within a network, and bins of session pairs are summarized by their
median similarity. Connectomes were computed for all 829 available sessions across 10
datasets; the analyses below use the 559 sessions from 7 datasets (friends,
harrypotter, hcptrt, mario, movie10, petit-prince, shinobi) carrying at least
30 minutes of usable data, covering all six participants. This 30-minute gate removes
floc, retinotopy, and things entirely.
Within-subject connectome similarity in friends — the most task-homogeneous dataset —
declines gently and monotonically with the number of seasons separating two sessions, the
only time axis available since sessions carry no acquisition dates
(Figure 2, panel A). The decline over a five-season lag ranges
from 0.019 (cerebellum) to 0.043 (Limbic network) — e.g., 0.956 to 0.935 in the Visual
network — and every network remains far above the between-subject floor (0.564–0.572).
Drift over years of scanning is therefore small relative to the gap between individuals.
Connectome similarity is also sensitive to cognitive context. Across four session-pair types, the ordering within-subject/within-dataset > within-subject/between-dataset > between-subject/within-dataset > between-subject/between-dataset holds in all 9 networks (e.g., Visual 0.95/0.80/0.69/0.63; Default 0.94/0.72/0.56/0.45; Figure 2, panel B). This contrast is not confounded by acquisition duration: similarity increases with session duration, so the four bins were matched by construction, with median pair minimum duration ranging only 2,669–2,784 s (within 4%) across bins. The between-dataset drop in similarity therefore reflects a genuine effect of cognitive state rather than a duration artifact or measurement noise.
Similarity also varies by network quality. The Limbic network has both the lowest median
tSNR (18.6) and the lowest within-subject similarity (0.859), and the cerebellum and
subcortex sit below the cortical networks on both measures
(Figure 2, panel C). This comparison is descriptive only: the
per-network tSNR values are available only for the floc, retinotopy, and things
datasets (182 sessions) — precisely the three datasets removed by the 30-minute gate —
while similarity is computed over the disjoint set of 559 gated sessions. With nine
network-level points and no shared sessions between the two axes, this panel establishes
an ordering, not a quantitative tSNR–similarity relationship.
As a robustness check on the state-dependence result, restricting the “different task”
comparison to a swap within a single naturalistic stimulus domain — movies (friends and
movie10, 333 sessions), video games (mario, mario3, mariostars, shinobi, 138
sessions), and stories (harrypotter, petit-prince, 19 sessions) — still yields
within-subject/within-task similarity exceeding within-subject/between-task similarity in
all 9 networks for all three domains (Figure 2, panels D–F),
with median gaps of 0.022 (movies), 0.047 (video games), and 0.077 (stories). The effect
is smallest for movies, where “different task” means a different film rather than a
different kind of activity; the stories domain, resting on only 19 sessions, is
suggestive rather than conclusive. Stratifying session pairs by head motion or by tSNR
does not change any of these orderings (not shown).
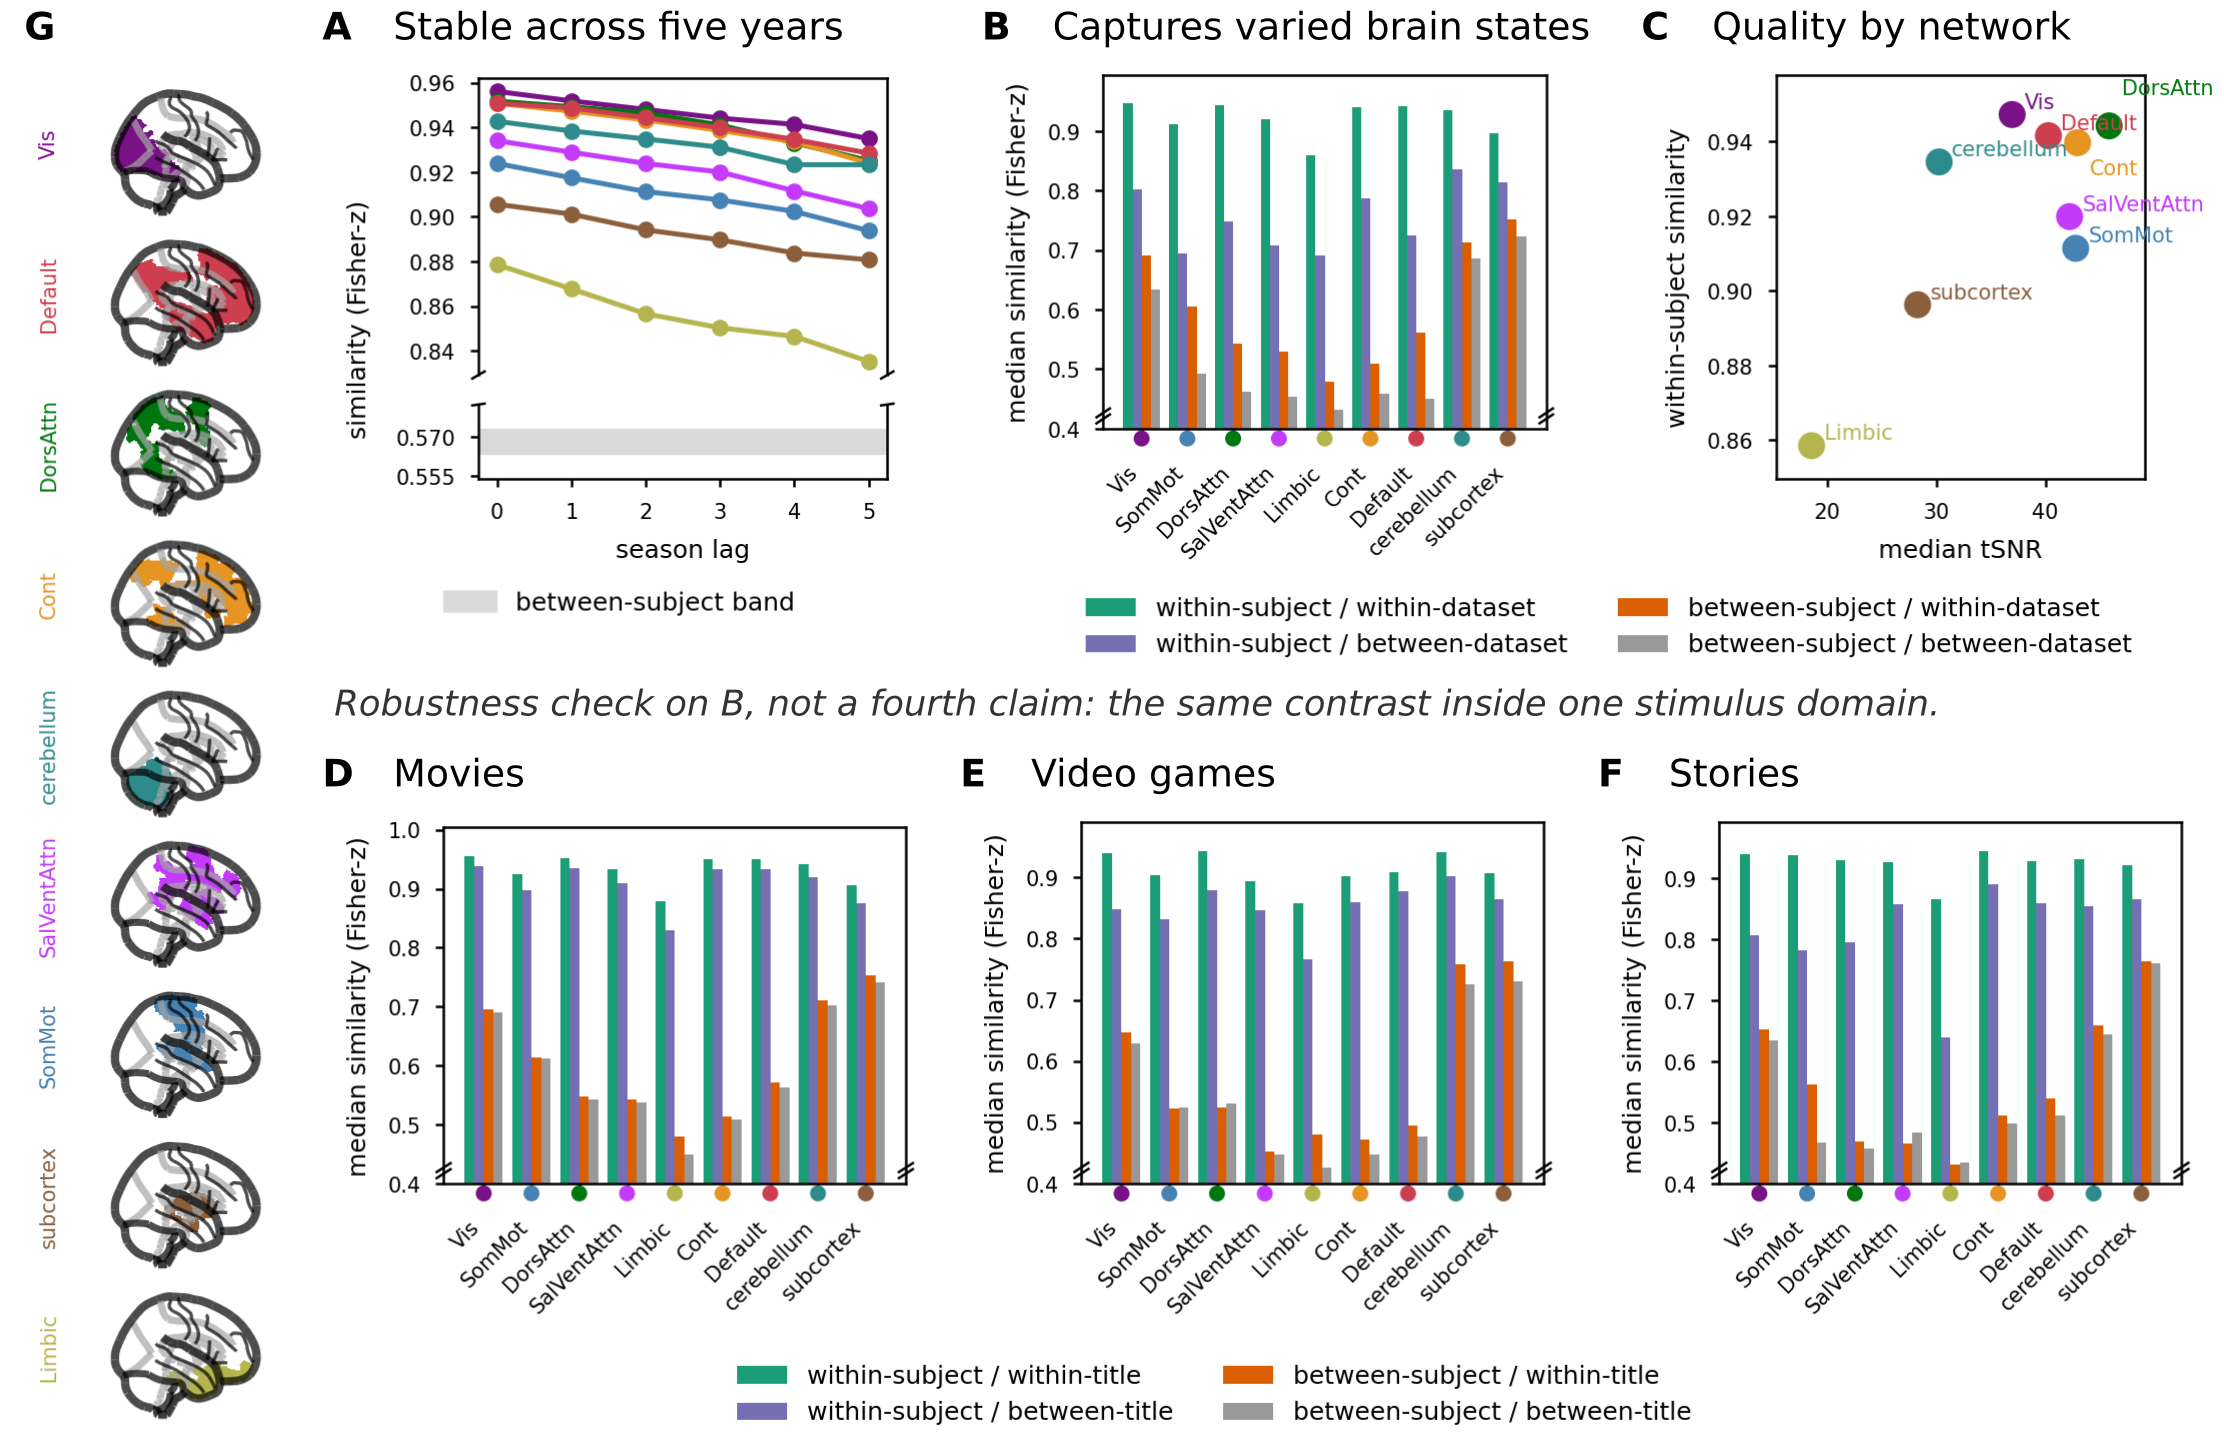
Figure 2:Functional connectomes from six deeply sampled individuals are stable across five years,
sensitive to cognitive context, and informative in every network. (G) Network key:
sagittal glass brains showing the anatomical extent of each of the 9 networks; colors are
used consistently throughout the figure. (A) Within-subject connectome similarity in
friends as a function of season lag, remaining well above the between-subject floor
(grey band). (B) Median similarity for within-subject/within-dataset,
within-subject/between-dataset, between-subject/within-dataset, and
between-subject/between-dataset session pairs, per network. (C) Within-subject
similarity against median per-network tSNR (disjoint session sets; see main text).
(D–F) The within- vs. between-task contrast of panel B repeated within a single
stimulus domain — (D) movies, (E) video games, (F) stories. Axes in (A) and in
(B, D–F) are truncated, with the break marked on the frame.
Preprocessing Pipeline Validation
[Describe any validation steps applied to preprocessed derivatives.]
- Esteban, O., Birman, D., Schaer, M., Koyejo, O. O., Poldrack, R. A., & Gorgolewski, K. J. (2017). MRIQC: Advancing the automatic prediction of image quality in MRI from unseen sites. PLOS ONE, 12(9), e0184661. 10.1371/journal.pone.0184661
- Power, J. D., Barnes, K. A., Snyder, A. Z., Schlaggar, B. L., & Petersen, S. E. (2012). Spurious but systematic correlations in functional connectivity MRI networks arise from subject motion. NeuroImage, 59(3), 2142–2154. 10.1016/j.neuroimage.2011.10.018
- Schaefer, A., Kong, R., Gordon, E. M., Laumann, T. O., Zuo, X.-N., Holmes, A. J., Eickhoff, S. B., & Yeo, B. T. T. (2018). Local-global parcellation of the human cerebral cortex from intrinsic functional connectivity MRI. Cerebral Cortex, 28(9), 3095–3114. 10.1093/cercor/bhx179
- Yeo, B. T. T., Krienen, F. M., Sepulcre, J., Sabuncu, M. R., Lashkari, D., Hollinshead, M., Roffman, J. L., Smoller, J. W., Zöllei, L., Polimeni, J. R., Fischl, B., Liu, H., & Buckner, R. L. (2011). The organization of the human cerebral cortex estimated by intrinsic functional connectivity. Journal of Neurophysiology, 106(3), 1125–1165. 10.1152/jn.00338.2011
- Tian, Y., Margulies, D. S., Breakspear, M., & Zalesky, A. (2020). Topographic organization of the human subcortex unveiled with functional connectivity gradients. Nature Neuroscience, 23(11), 1421–1432. 10.1038/s41593-020-00711-6
- Nettekoven, C., Zhi, D., Shahshahani, L., Pinho, A. L., Saadon-Grosman, N., Buckner, R. L., & Diedrichsen, J. (2024). A hierarchical atlas of the human cerebellum for functional precision mapping. Nature Communications, 15, 8028. 10.1038/s41467-024-52371-w